Are the Orioles forgoing Defense for Power?
“Pitching, Defense, and the Three-run Homer“
It’s a philosophy that has become ingrained in Baltimore baseall for decades. Under this philosophy employed by Earl Weaver, the Baltimore Orioles became the most successful franchise in all of sports for two decades. Weaver’s pitchers won 20 games on 22 occasions (six went on to win the Cy Young Award), his fielders won 34 Gold Gloves, and his clubs were in the top five in home runs in the American League 11 times. The Orioles during Weaver’s tenure amassed a .583 winning percentage, six division titles, four pennants, and the 1970 World Series championship.
With the hiring of Buck Showalter, the Baltimore Orioles have experienced their own resurgence. Since start of 2012 season, the Orioles lead the AL in wins and rank fifth in the majors with a 354-293 (.547) record. Their team has managed to lead the majors with 854 HRs and led the league two out of the four yeras. The pitching rotation….well that’s another story for another article. However, the team has been heralded as being a defensive juggernaut with their fielders netting 10 gold gloves during this short period.
Advanced fielding statistics though do not hold the Orioles in the same high regard. Since 2012, the Orioles rank 11th in MLB per Defensive Runs Saved and 9th in Ultimate Zone Rating. This may be a bit surprising to some fans as the Orioles have ranked first in MLB in fielding percentage (a fact that Jim Hunter will be quick to point out).
The simple answer is that the two most cited defensive stats prior to the creation of these advanced metrics — errors and fielding percentage — have major flaws. Errors are determined by the official scorer, and can be susceptible to human error. Anyone who has watched enough games can remember an instance where they thought an error would be given, but was not. Fielding percentage also uses errors, but also doesn’t take a player’s range into account. A rangy player doesn’t get extra credit for reaching more balls than a statue (Delmon Young) who can make plays only when the ball is hit right at them.
Each of these advanced systems have flaws still within them due to the implementation of a human system of crediting value to plays. However until STATcast data is available to the public, these values cannot be ignored for their value. Let’s go through and understand how each of these stats are determined.
Ultimate Zone Rating (UZR) is scaled where 0 equals the league average. A positive value means the player was an above-average defender, while a negative value means that player was a below-average defender. The resulting number attempts to tell fans how many runs a player saved or cost his team due to defense. The data that goes into UZR is pulled from Baseball Info Solutions, a company that specializes in collecting delivering and baseball data. UZR can be found on FanGraphs.com.
UZR uses a zone-based method to determine value. The field is broken up into different zones and players are then assigned value based on how many plays they make in each zone. UZR examines how often the average player makes a play in those zones. If a player makes an exceptional play, he receives a small positive value to his UZR for that play. However if play is not made, a player and potentially multiple ones can be penalized on the same play (a factor that is not attributed for in FP).
Defensive Runs Saved (DRS) is similar in many ways. Both UZR and DRS operate on the same scale, where 0 is league average. DRS also utilizes zone-based data, which is pulled from BIS, in order to rate defense. Like UZR, DRS attempts to adjust for park factors. Each stat has slightly different ways of calculating the final product, but both are actually fairly similar.
The biggest difference between the two is that DRS uses a one-year sample when comparing plays.This is unlike UZR, which compares that play to multiple seasons of data before assigning a value. This is controversial, but it may help if their is constant turnover in folks auditing plays. Also while both systems utilize zone-based data, DRS breaks them up into smaller zones in order to attempt to be more precise. If unclear if the data is more precise, but it’s one of the main differences between the two stats.
Now that we have a better understanding of these advanced fielding statistics, let’s look at the numbers for the Orioles per season and how they rank in MLB:
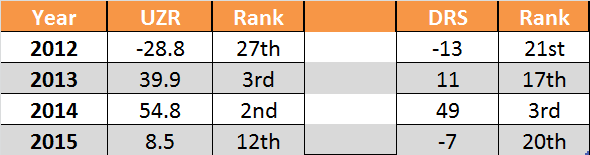
The numbers are disjointed, but shouldn’t be surprising for most Orioles fans that can recall the past few seasons. Prior to the appearance of Manny Machado in 2012, the Orioles were a mess in the infield with Wilson Betemit logging the most innings at the position with a -4.6 UZR and -6 DRS over 608.2 IP. Of course this performance wouldn’t be outdone by the failures of Mark Reynolds who posted a -5.2 UZR and -7 DRS over only 142 IP. The most surprising numbers from these would be Nick Markakis who logged a -8.6 UZR and -7 DRS over 926 IP. This doesn’t seem to make sense and in fact Markakis has historically been a controversial topic regarding the use of these statistics.
However, Manny Machado did come in 2012 and the defense flourished since his arrival. Folks that want to state that baseball players thrive off each other and that stats don’t play in a vacuum could easily point back to this moment as the resurrection of Orioles baseball through defense once again. He has led the team with 51.5 UZR and 62 DRS, which rates 4th and 5th respectively during this time. However, we can’t overlook the impact that it has also had on players like JJ Hardy who has put up a respectable 39.3 UZR and 40 DRS, which rates 11th and 20th respectively in MLB during this time. The infield defense has been set and hopefully if Hardy can remain healthy, this tandem can continue their production into 2016.
So where is the deviation in defense occuring that has caused this team to shift around so significantly. The most obvious ones appear to be at second base and outfield. From 2014 to 2015, the Orioles suffered the following changes in performance at these positions:
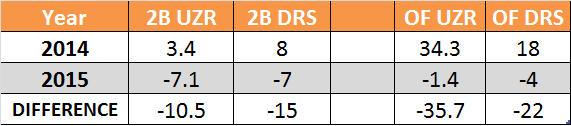
A loss of 46.2 UZR and 37 DRS is a huge deviation for the team. Typically, 10 runs represents a win meaning that the Orioles lost around four games last year strictly on defensive turnover over one year. What changed?
The second base change was impacted with the injury to Jonathan Schoop. Schoop went from posting a 5.8 UZR in 2014 to -5.0 in 2015. The injury impacted his range on the field and as such he wasn’t able to make the dynamic plays in the field besides the strong arm double play turn that we have been accustomed to as fans. But the injury also impacted the Orioles in the need to play alternate fielders. Typically, Ryan Flaherty would have served in this role. However, he was injured as well during this time. This resulted in a platoon rotation of Rey Navarro, Jimmy Paredes, Everth Cabrera, and (most surprisingly) Steve Pearce. This platoon posted a -1 UZR and -4 DRS over only 256 IP. Ryan Flaherty managed to salvage the rest of the time posting a respectable -1.2 UZR and 0 DRS over 448 IP. The return of a healthy Schoop should allow for a return of defense back to the mean of the two years, but potentially not as good as 2014.
However, the biggest deviation comes from the outfield which would be responsible only on defense for yielding two to three wins. We’ve already talked about Nick Markakis earlier. However, it warrants mention that in 2014 the advanced defensive statistics finally decided to look favorable upon. He posted one of his best seasons (per the numbers) with a 6.2 UZR and 1 DRS. This is interesting because nothing in this year stands out that Markakis should have had a sudden resurgence, but the Orioles did begin to employ a higher degree of outfield shifts during this year. These shifts may have assisted in Markakis with his limited range, especially if Jones was able to assist him in certain situations to prevent the ball from dropping in front of either of them. These two players had also built up an understanding of their play at this point resulting in a possible synergistic benefit related to their defensive numbers. During the 2014 season, Markais played in almost 90% of all IP for the RF position.
And then there was 2015.
The Orioles sent a platoon squad of Gerardo Parra, Delmon Young, Chris Davis, Travis Snider, Dariel Alvarez, Alejandro De Aza, Steve Pearce, Chris Parmelee, Nolan Reimold, Ryan Flaherty, Jimmy Paredes, and David Lough. Gerardo Parra who the Orioles acquired at the trade deadline logged the most innings (352.1 IP), but only played 24.5% of all IP for RF. In total, the Orioles posted a -1.2 UZR and a -8 DRS. Overall, the Orioles lost a total value of 7.5 UZR and 13 DRS in RF alone. Wait, that doesn’t make up the whole difference? What gives!
Let’s turn our eyes to Left Field instead. It can’t be there. Nelson Cruz played LF in 2014 and he’s terrible. Or did he? Well he wasn’t terrible per se, but he wasn’t necessarily good. Cruz in 501.2 IP posted a 1.8 UZR and 1 DRS. However, the real story of 2014 from advanced defensive statistics was David Lough and Steve Pearce. Both players together posted a 13.3 UZR and 14 DRS over 629 IP. They were able to put together a banner season defensively with players like the following:
And then there was 2015.
The Orioles employed the platoon,similar to that of RF, with the hopes that Steve Pearce could back up his career year. Unfortunately, Pearce fell to the challenge posting a -2.3 UZR and -3 DRS in 305.2 IP. Lough also put up weaker numbers with .9 UZR and 7 DRS. With this combined effort, the Orioles lost a total value of 16.3 UZR and 3 DRS in LF alone. It’s interesting that this position seems to have performed significantly different between UZR and DRS. I would imagine that maybe the UZR finally caught up with Pearce in this year based on the mult-year sample size. As such, the shine that was on him in 2014 had come off with a larger sample size compared to the rest of the league.
The Orioles also suffered a loss in CF from 2014 to 2015 with the late season injury to Adam Jones. Jones losing playing time to Parra and Junior Lake will of course show up in the stats. A loss of 11.8 UZR and 6 DRS was the impact of such an injury. It places emphasis just like the Schoop injury on the lack of depth the Orioles have at this position.
And now we begin the journey to 2016.
The Orioles are prepared to enter into the season with potentially another platoon option in the outfield. The outfield has been constructed of Hyun Soo Kim who has been described as at best an average fielder and Mark Trumbo who has been described as a warm body that may catch something periodically. If the Orioles are planning this approach, should the Orioles expect to get back to their 2014 defensive statistics? Based on the numbers, it’s not likely.
A common offshoot of Ultimate Zone Rating is UZR/150, which scales the performance towards 150 games played. With the LF and RF position, the Orioles posted a -1.0 and -1.5 UZR/150 respectively compared to a 15.3 and 6.0 in 2014. It’s unlikely that either player on the Orioles will be able to achieve this result. In fact, Mark Trumbo has over his career posted a -11.8 UZR/150 in RF. It’s why the loss of a player like Dexter Fowler is upsetting because the Orioles could have potentially achieved this result especially if you buy into the range synergy that we discussed earlier with Markakis/Jones.
Are there any internal options that the Orioles could provide that could yield favorable results in this category? As we discussed from 2014, Nelson Cruz was able to fill in adequately during his time in LF. The Orioles combined his time with late inning platoon work to employ outfielders that were more defensively advantageous. Joey Rickard has shown the best hope for this during Spring Training. He’s displayed good range and instincts in the field that make him look like a serviceable 4th OF/Back-up CFer. He probably can’t come close to replicating the advanced defensive statistics love for Lough, but he could easily serve to hedge the ledger towards the positive as a replacement in the 7th inning or after. Dariel Alvarez could also be an option if Joey Rickard fails. While Alvarez has struggled at the plate, his arm has shown flashes as being dominant.
It’s unlikely that the Orioles will get back to that 2014 season due to their outfield depth. However, the Orioles need to hope that their health remains in the infield where they have been the strongest. If they are able to get Schoop back to full health and see some stabilization in the outfield, the Orioles may be able to recovery around 20 runs or 2 wins. Maybe that’s enough with all the home runs they are going to hit this year. However, it’s not a good way to balance yourself as a team when the hits disappear like they did in August last year.
If only Earl could loan us some of that pitching.